GSoC-2017 : Working on Anomaly Detection at CERN-HSF
A comprehensive article about DeFi, trading, and blockchain technology.

 This year was my first time working as a student in Google’s Summer of Code program. I was accepted by the CERN-HSF organisation to work on an Anomaly Detection Project under the ATLAS sub-organisation. The purpose of this post is to serve as a summary of my efforts, both achievements and failures, over the summer of this massive undertaking.
I would like to thank my mentors Mario, Alessandro and Tomas from CERN-HSF for guiding me on this journey!!
**DeepAnomaly — **Mission Statement
ATLAS Open Analytics is a platform which collects data generated from the various computing operations between the multiple participating heterogeneous computing centers.
My project with CERN-HSF was all about using machine-learning for identifying anomalies in this time series data.
The idea is to design, build and deploy a framework that is able to monitor, classify and cluster anomalous behaviour in this real-time ATLAS Distributed Computing data and then act on this information autonomously.
The Goal
To build an Automated Pipeline which triggers anomalies and then analyses them to predict their root cause as well as some potential solutions.
The idea is for the system to learn from both historical and live data and make accurate predictions about such anomalous events.
Data Exploration
 Most of the ADC data is stored in two different ElasticSearch instances. For people like myself who are new to this totally awesome tool, ElasticSearch is a distributed, RESTful search and analytics engine. The best part about ElasticSearch is that it’s really fast, almost realtime. It allows you to store, index and distribute your data in a really convenient way. Combine that with some really flexible and intuitive visualisation tools like Kibana and it becomes really attractive, especially if you have massive amounts of data.
I personally used python’s two elasticsearch libraries for dealing with elasticsearch instances : elasticsearch-py and elasticsearch-dsl.
At any given point of time, the main CERN ES instance contains 31 “atlas-rucio-events-*” indices , one for each of the past 31 days. Due to the truly vast nature and wide variety of data available, my mentor , Mario, advised me to start with only ‘transfer-done’ events within these “atlas-rucio-events” indices.
I started by querying events of the type — “transfer-done” and saving them into local DataFrames. Typically every index contains 1,000,000–2,000,000 of such events and every such event has 26 sub-fields which contain various info about that specific transfer like it’s source, destination, size of the file being transferred etc.
This was my first look at the data and below are some important plots I made while exploring and extracting the data -


 It’s common for some files to get queued for an entire week!!( 1 week~=600000 seconds)
Apart from these continuous variables there were quite a lot of categorical variables for me to deal with. Here are a few histograms depicting their distribution-frequency in a single index:


 Not taking any risks, I selected all the variables that could be meaningfully parsed as inputs for any model and might be influential for deciding the duration of a transfer. I arrived at a total of 10 variables that would serve as my training data for the future models.
Machine learning for Anomaly detection
After understanding what the different variables in the data actually meant, I began to actually work on identifying anomalies within these transfers. I don’t think I ever really understood what looking for ‘needle in the haystack’ actually meant up-till now.
As part of my community bonding period I had done quite a bit of research for ML algorithms specific to time-series data. Most of the models used by scientists in various research papers and articles employed some sort of “supervised-learning approach” to such a problem. But here the situation was slightly different. Within these massive dataframes of transfer events, there was no label separating anomalous transfers form the normal ones. An unsupervised approach was the probably the way forward and I had mentioned this earlier in this my original proposal too.
Choice of ML Model:
Neural Networks
One thing that we had going on for me was that there was literally millions of data points for me to train a Machine Learning Model on!! Also I was reliably informed that the percentage of occurring anomalies was extremely low, about 1 / 1000. Armed with this knowledge I started by implementing various feedforward architectures in Keras trying to predict the transfer duration for a particular transfer with varying success.

 Almost all the feedforward architectures I tried, deeper, wider, different/advanced activations …all pretty much demonstrated similar performance. The model learned for a while and then plateaued out at a level that wasn’t very good. I tried different scaling options to see if it made any difference but there wasn’t any significant improvement.
Recurrent Neural Networks- Long Short Term Memory Networks
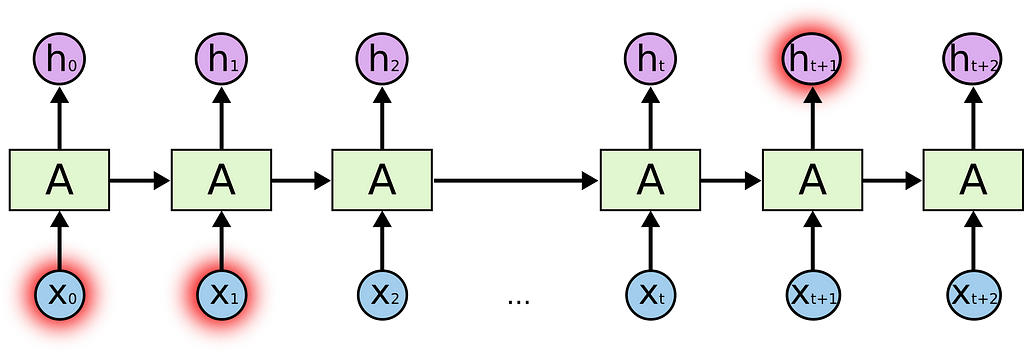 After doing some experimentation with feedforward nets, I finally arrived at RNNs. Given the time-series nature of my data, they were my most ideal choice and I was optimistic about them.
I started with simple LSTM networks with a single LSTM and began training them on transfer-events in time-steps on 10 events. They were slightly better than previous architectures but not much. After hassling with multiple stacked layers, more LSTMS/GRU cells per layer and training the network with data where every datapoint went farther back into it’s history, I finally arrived at the following architecture:
 This model takes inputs in timesteps of 100 events i.e. for predicting duration for every single transfer, it considers the details of that transfer + details of 99 transfers which came before this one. Every single of these transfers further has 9 inputs — file_size, time_in_queue, source, destination, activity, protocol, transfer-endpoint, src_type, dst_type.
For an input of dim (100, 9) , the network outputs a single value (the transfer duration of the 100th transfer in the input). We trained this network on a dataset of millions of such events and never more than 2 iterations for every event. This was done so as to ensure that the model doesn’t learn to map any anomalous events in the dataset. Here are some performance plots of the network when evaluated on 200,000 previously unseen transfers:


 This was by far the best performing model that I had gotten.
Threshold used:
- To distinguish anomalies from the normal events I used a threshold of 600 seconds. Transfer events whose actual transfer duration was more than 600 seconds longer than the predicted one were labeled as anomalies.
Analysing the detected Anomalies
After building the network for detecting anomalies, next step was to verify them and identify their root causes. This proved quite challenging as the number of detected anomalies was still too large. It was at this point I started collaborating with Tomas. With no potential resource to actually verify the detected anomalies, It was still harder to investigate their causes.
 After sometime of exploring, and researching my results and multiple discussions with Tomas, we arrived the following conclusions:
- I needed a better labelling criteria to tag events as anomalies; something more robust than just a single error threshold.
- The number of anomalies identified needed to be brought down to a more manageable number.
Using “PerfSonar” Data
The ultimate purpose of this project is to fix the problems causing the detected anomalies in the system. This can only be done by** fixing the specific source-destination link over which the transfer-anomaly occurred**.
CERN has a system which measures some core statistics about performance of such source-destination pair links. These statistics include information like ‘throughput’, ‘latency’ and ‘packet_loss_rate’. I believe this data can serve as the basis for a better anomaly-triggering system for detecting anomalies based on the LSTM model predictions.
For Example-
- A transfer event with high deviation value from the predicted-transfer-duration which is being transferred over a src-dst link with an abnormally high packet loss rate, is much more likely to be an anomaly.
- Similarly , the throughput metric can be used to group anomalies being transferred over the same src-dst link.
This is the state to which my efforts have taken it. As of the day of writing this post, I’m still struggling with the perfSonar data. The road has been tough but I believe that my work has successfully demonstrated that the system to detect and fix anomalies is certainly feasible.
Failures and ShortComings:
This project was my very first experience with professional coding. I had never worked on a project of this scale, size an complexity. Although I’m proud to have made the progress that I’ve made up-till now, there are some problems where I found myself lacking:
- Implementing a live trigger — the purpose of this was to simultaneously extract data being index in realtime, preprocess it, run it through the model, and detect anomalies within. Due to my lack of experience working with multitasking scripts, I was unable to implement it successfully.
- The current model is sometimes unable to capture high spikes for some non-anomalous transfers with bigger transfer-sizes.
Although my official work period I would love to keep working on this project and see it through to it’s completion and deployment!!
Git Repository — DeepAnomaly
GSoC-2017 : Working on Anomaly Detection at CERN-HSF was originally published in TDS Archive on Medium, where people are continuing the conversation by highlighting and responding to this story.